Gitリポジトリを複数の人と共有したいが、
gitosis – Git リポジトリ群の管理とアクセス制御 vol.0 gitosis – Git リポジトリ群の管理とアクセス制御 vol.1
このページが大変参考になった。
以下、既存のgitリポジトリをgisosisでアクセス制御するところまで設定できたので記録。
前提
gitサーバ……..gitserver.yamakk.com
クライアントA (MacBookPro 実作業)……..mcbk.local
クライアントB (VMWare上のCentOS5)……..cent5.local
前準備1
% ssh-keygen -t dsa
前準備2
Host gitserv
HostName gitserver.yamakk.com
port 12345
これで
以下の表記
実際の設定Read the rest of this entry »
Posted: August 12th, 2010 | Author: yamakk | Filed under: 技術 | Tags: git , gitosis , redmine | No Comments »
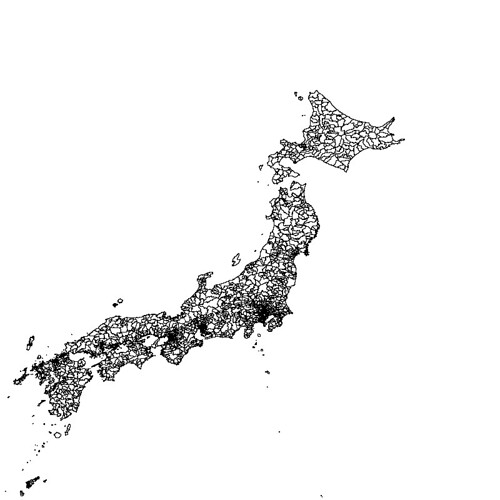
国土数値情報統一フォーマットのダウンロードサービス 行政界・海岸線(面)のデータを国土数値情報データ変換ツール をつかってShapeに変換したものをPostGISにinsertする。
参考 国土交通省にあるGISデータをPostGISへインポート(改訂版)
流れとしては,
47都道府県のPolygonをバッチでPostGIS DB入れられるようスクリプトを書いた.
#coding:utf-8
import os
import glob

for dir in glob.glob('N03*'):
    basename = os.path.basename(dir)
    _shp = '%s*.shp' % (os.path.join(dir,basename))
    shapefile = shapefile = glob.glob(_shp)[0]

    create_sql = '%s_createtable.sql' % os.path.join(dir,basename)
    create_cmd = 'shp2pgsql -p %s japan > %s' % (shapefile, create_sql)
    print create_cmd
    os.system(create_cmd)

    insert_sql = '%s_insert.sql' % os.path.join(dir,basename)
    insert_cmd = 'shp2pgsql -W cp932 -a %s japan > %s' % (shapefile, insert_sql)
    print insert_cmd
    os.system(insert_cmd)

    load_create_cmd = 'psql -U postgres gistest < %s' % create_sql
    load_insert_cmd = 'psql -U postgres gistest < %s' % insert_sql

    print load_create_cmd
    os.system(load_create_cmd)
    print load_insert_cmd
    os.system(load_insert_cmd)
実行
$ python import_polygon.py
SQLで入っているか確認
$ psql -U postgres gistest
psql (8.4.4)
Type "help" for help.

gistest=# SELECT prn, cn2, SUBSTRING(AsText(the_geom), 0, 100) from japan limit 5;
 兵庫県 | 豊岡市 | MULTIPOLYGON(((134.793994 35.668108,134.793978 35.668144,134.793915 35.668139,134.793854 35.668166,
 兵庫県 | 豊岡市 | MULTIPOLYGON(((134.762469 35.674204,134.762507 35.674247,134.762601 35.67427,134.762675 35.674276,1
 兵庫県 | 豊岡市 | MULTIPOLYGON(((134.762035 35.673419,134.762049 35.673454,134.762098 35.673476,134.762188 35.673457,
 兵庫県 | 豊岡市 | MULTIPOLYGON(((134.761883 35.672992,134.761889 35.673025,134.761921 35.67304,134.761951 35.673035,1
 兵庫県 | 香美町 | MULTIPOLYGON(((134.535152 35.66762,134.535201 35.66763,134.535221 35.667637,134.535186 35.667659,13
吉祥寺駅付近の(x,y)=(35.7031,139.5797)で検索 //PostGISの座標表記はすべてyx順
$ psql -U postgres gistest
psql (8.4.4)
Type "help" for help.

gistest=#SELECT prn, cn2 FROM japan WHERE ST_Contains(the_geom, GeomFromText('POINT(139.5731 35.7031)'));
  prn   |   cn2
--------+----------
 東京都 | 武蔵野市
(1 row)
Spatial Indexを作成する
$ psql -U postgres gistest
psql (8.4.4)
Type "help" for help.

gistest=#CREATE INDEX inx_japan ON japan USING GIST (the_geom GIST_GEOMETRY_OPS);
CREATE INDEX

gistest=# VACUUM ANALYZE japan;
VACUUM
MapServerで確認
MAP
    SIZE 800 800           #画像size
    EXTENT 128 33 150 44   #出力範囲の座標
    STATUS ON              #地図を表示するか
    UNITS DD               #地図の単位(DD は緯度経度)
    IMAGECOLOR 255 255 255 #背景色R G B
    IMAGETYPE PNG          #地図画像を保存する形式
    LAYER
         NAME "japan"
         CONNECTIONTYPE POSTGIS
         CONNECTION "user=postgres password='' dbname=gistest host=localhost"
         DATA "the_geom FROM japan" #select文
         TYPE LINE
         STATUS ON
         CLASS
             COLOR 0 0 0
         END
    END
END
$ sudo yum install gd-devel
$ wget http://download.osgeo.org/mapserver/mapserver-5.6.5.tar.gz
$ ./configure --with-postgis=/usr/local/pgsql/bin/pg_config --with-proj=/usr/local
$ make
$ ./shp2img -m japan.map -o japan.png
japan.png
Posted: July 21st, 2010 | Author: yamakk | Filed under: 技術 | Tags: mapserver , postgis , postgres | No Comments »
Install PostgreSQL
$ sudo /usr/sbin/adduser postgres
wget http://www.ring.gr.jp/pub/misc/db/postgresql/source/v8.4.4/postgresql-8.4.4.tar.gz
$ ./configure
$ make
$ sudo make install
$ sudo chown -R postgres:postgres /usr/local/pgsql
.zshrc
export PGHOME=/usr/local/pgsql
export PGLIB=$PGHOME/lib
export PGBIN=$PGHOME/bin
export PGDATA=$PGHOME/data
export PATH=$PATH:$PGBIN
export LD_LIBRARY_PATH=/usr/local/lib:$PGLIB
Start PostgreSQL
$ su postgres -c "initdb --no-locale --encoding=UTF8"
$ su postgres -c "pg_ctl -w start"
---
LOG:  database system is ready to accept connections
 done
server started
PostgreSQL startup script
$ sudo cp /home/postgres/postgresql-8.4.4/contrib/start-scripts/linux /etc/rc.d/init.d/postgresql
$ sudo chmod 755 /etc/rc.d/init.d/postgresql
$ sudo chkconfig --add postgresql
$ sudo chkconfig postgresql on
$ service postgresql start
/etc/ld.so.conf
include ld.so.conf.d/*.conf
/usr/local/lib
/usr/local/pgsql/lib/
then
/sbin/ldcondig
Install Proj
wget http://download.osgeo.org/proj/proj-4.7.0.tar.gz
$ ./configure
$ make
$ sudo make install
Install Geos
wget http://download.osgeo.org/geos/geos-3.2.2.tar.bz2
$ ./confiture
-----
Swig: false
Python: false
Ruby: false

$ make
$ sudo make install
Install libxml2
$sudo yum install libxml2-devel
Install PostGIS
wget http://postgis.refractions.net/download/postgis-1.5.1.tar.gz
$ ./configure --with-geosconfig=/usr/local/bin/geos-config --with-projdir=/usr/local/lib
PostGIS is now configured for i686-pc-linux-gnu

 -------------- Compiler Info -------------
  C compiler:           gcc -g -O2
  C++ compiler:         g++ -g -O2

 -------------- Dependencies --------------
  GEOS config:          /usr/local/bin/geos-config
  GEOS version:         3.2.2
  PostgreSQL config:    /usr/local/pgsql/bin/pg_config
  PostgreSQL version:   PostgreSQL 8.4.4
  PROJ4 version:        47
  Libxml2 config:       /usr/bin/xml2-config
  Libxml2 version:      2.6.26
  PostGIS debug level:  0

 -------- Documentation Generation --------
  xsltproc:             /usr/bin/xsltproc
  xsl style sheets:
  dblatex:
  convert:              /usr/bin/convert

$ make
$ sudo make install
Test Installation
$ su postgres
$ cd /home/postgres/postgis-1.5.1
$ make test
---
 ok
 regress_buffer_params. ok
 hausdorff. ok

Run tests: 49
Failed: 0
Create GIS database
$ createdb gistest
$ createlang plpgsql gistest
$ psql -d gistest -f /usr/local/pgsql/share/contrib/postgis-1.5/postgis.sql
$ psql -d gistest -f /usr/local/pgsql/share/contrib/postgis-1.5/spatial_ref_sys.sql
SQL
$ psql -U postgres gistest
gistest=# CREATE TABLE gis(id SERIAL);
gistest=# SELECT AddGeometryColumn('gis', 'latlng', 4326, 'POINT', 2);
gistest=# SELECT AddGeometryColumn('gis', 'line', 4326, 'LINESTRING', 2);
gistest=# SELECT AddGeometryColumn('gis', 'polygon', 4326, 'POLYGON', 2);
gistest=# INSERT INTO gis (latlng, line, polygon) VALUES (GeomFromText('POINT(50 50)', 4326), GeomFromText('LINESTRING(1 1, 99 99)', 4326), GeomFromText('POLYGON((25 25, 75 25, 75 75, 25 75, 25 25))', 4326));
gistest=# select AsText(latlng), AsText(line), AsText(polygon) from gis;
    astext    |        astext         |                  astext
--------------+-----------------------+------------------------------------------
 POINT(50 50) | LINESTRING(1 1,99 99) | POLYGON((25 25,75 25,75 75,25 75,25 25))
(1 row)
Posted: July 21st, 2010 | Author: yamakk | Filed under: 技術 | No Comments »
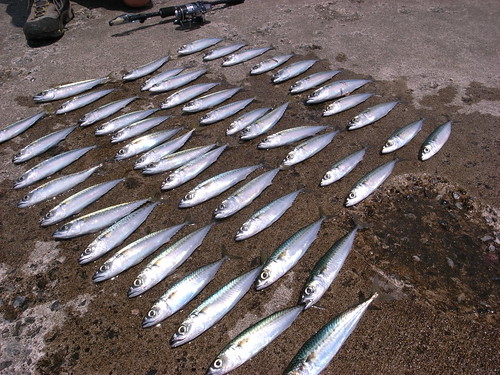
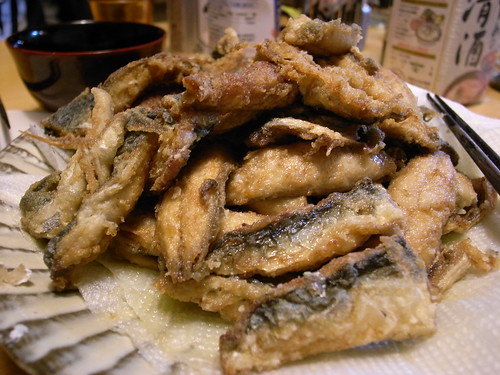
小サバが大量に釣れたので南蛮漬を作った。
漬けられる前の揚げたて状態
今回の作り方
サバを三枚に下ろす
漬汁(適当)=そばつゆ200cc、酒25cc、水100cc、酢50cc しょうが、にんにくをひとかけすりおろす
漬け汁に通したサバに片栗粉と小麦粉をつけて、油で3分揚げる
漬け汁につけて冷蔵庫で冷やす
ポイントはしっかり冷やすこと。と酢を多めに使うことだったような気がする。
釣りしているときに鯖をエサにして泳がせてたら、ウツボらしき巨大魚が掛かったけど捕獲できず。
cookpad あじの南蛮漬
Posted: July 11th, 2010 | Author: yamakk | Filed under: outdoor , 食べ物 | Tags: サバ , 三浦 , 釣り , 鯖 | No Comments »
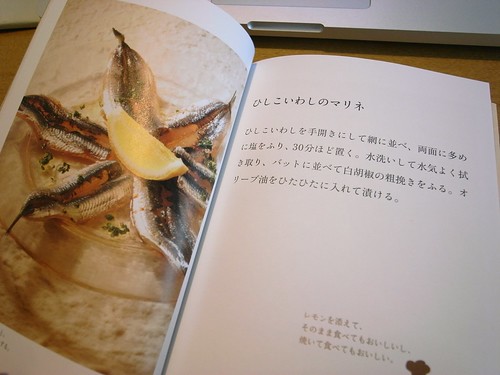
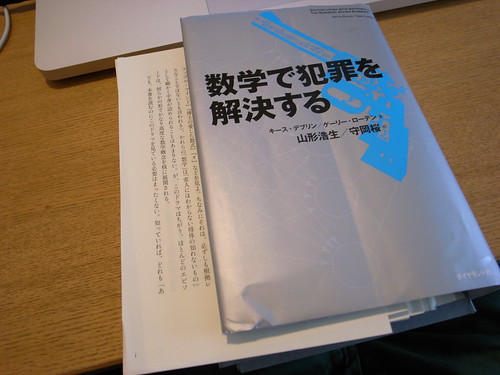
仕事の話をしにいった先でもらった。地図と同じくレシピもよめない人間なので140文字でまとめてくれるのはとても助かる。iPadでも見たいけど、頂いた本なので裁断はしない。
Posted: July 6th, 2010 | Author: yamakk | Filed under: 本 , 食べ物 | Tags: recipe , twitter | No Comments »
今日 SimpleGeo という位置情報APIを提供するクラウドサービスにふれた。中で使っているDBは
We call it GiselleDB. Based on Cassandra and other NoSQL
らしい。
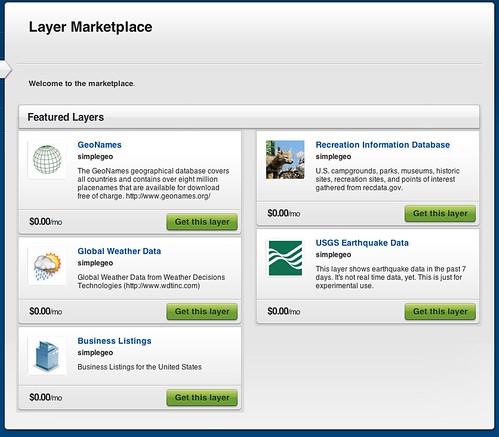
SimpleGeoにはLayerという位置情報データを貯めておくストレージがあって、1つだけなら無料で作って動かすことができる。この無料プランの場合、APIの呼び出しは月100万回まで。 有料プランは$399〜$9999まであってAmazonS3にバックアップができる。SimpleGeo – Plans & Pricing
面白そうなのが Layer MarketPlace で、いくつか無償のLayerが提供されている。天気や震源地のLayerや米国政府が提供している保養地のLayerとかもある。これらを自分のLayerと組み合わせたりして、マッシュアップアプリが作れる。
以下アカウントをつくってPythonで使うAPIのチュートリアルをやってみた。How do I get started using Python?
Read the rest of this entry »
Posted: July 6th, 2010 | Author: yamakk | Filed under: 技術 | Tags: api , cassandra , geo , gis , nosql , python , simplegeo | No Comments »
図書館で借りておもしろかったので、Amazon中古で購入。すでに裁断されていた。もう一冊本棚用に買う予定。
米国TVドラマNUMB3RSのなかの数学を詳しく解説した本で、ドラマの中だとあまりちゃんと説明してくれないところとかが理解できるように書かれている。たとえば、煙にまかれたような感じで終わるモンティ・ホール問題(ベイズ確率) も、本を読めばかなり深く理解できる。
先に本を読んだからといって、ストーリーがネタバレしないのも安心。
Posted: July 5th, 2010 | Author: yamakk | Filed under: 技術 , 本 | Tags: math , numb3rs | No Comments »
買って1ヶ月、10冊くらいの本を裁断してpdfにして読んで使った感想。
第一に、読みたいけど所有したくない本を買えるようになった。
例えば、100円でブックオフで売っている本に、所有欲を満たすものはほとんどない。それどころか金もらっても本棚に置きたくないものもある。けれどそういうジャンク本が、実は意外と読んでみたいというケースは結構あって、iPadを買ってからそういう本をわりと躊躇せず買うようになった。家の本棚に並べずスペースもとらないし人にも見られないので、「所有したくない欲」を傷つけないということなんだと思う。
あと紙の本を読むとき、ページを手で抑えるのに結構力をいれていたことに気づいたことも、あたりまえだけど新鮮だった。iPadだと手はページをめくる時以外必要ないので、両手をどうしてよいかわからない。ただ楽な一方、ページをばーっとめくってさがすということが出来ないのはかなりストレスがたまる。なので、面白い本は紙媒体のまま所有したいという思いもある。将来解決策が電子化できるのかは謎。
よって、面白い本は二冊買って一冊は裁断してpdf。もう一冊は本棚へという、楽園に向かっているのか地獄に向かっているのかわからない状況になっている。それと並行して、愛着もない技術書とかジャンク本をスキャンしてどんどん捨てて、空いたスペースに面白い物理的な書籍を揃える方向で、ブックオフとスキャナーを往復している。
Posted: July 4th, 2010 | Author: yamakk | Filed under: 技術 , 本 | Tags: bookoff , ipad | No Comments »
数学を使って犯罪を解決するアメリカのTVドラマ。シーズン1を全部見た。本当に使える数学を、実際に使われている方法で伝えるというところがすごく面白い。小さい頃これ見てたらかなり影響受けたんじゃないかと思う。
NUMBERSと数学
個人的におもしろかった回は
脱走犯の追跡 ベイズ統計、モンティ・ホール問題
少女誘拐事件 リーマン予想と暗号理論
盗まれた核廃棄物 ゲーム理論
逆にイマイチだったのは
鉄道破壊計画
危険な高層ビル
あたりだった。
モンティ・ホール問題については、主人公のチャリー教授が初心者向けの公開講座で説明するシーンがYouTubeにあったりもする。
Posted: July 4th, 2010 | Author: yamakk | Filed under: 技術 | No Comments »
Today I installed R (vesion2.11.1 2010.5.31) from mac installer.
Here is my install log.
install numpy and rpy2 via pip
pip install numpy
pip install rpy2
import rpy2.robjects as robjects

ctl = robjects.FloatVector([4.17, 5.58, 5.18, 6.11, 4.50,
                            4.61, 5.17, 4.53, 5.33, 5.14])
trt = robjects.FloatVector([4.81, 4.17, 4.41, 3.59, 5.87,
                            3.83, 6.03, 4.89, 4.32, 4.69])

correlation = robjects.r('function(x, y) cor.test(x, y)')
print correlation(ctl, trt)
$ python Desktop/correlation_sample.py

	Pearson's product-moment correlation

data:  x and y
t = -1.4559, df = 8, p-value = 0.1835
alternative hypothesis: true correlation is not equal to 0
95 percent confidence interval:
 -0.8440680  0.2415684
sample estimates:
       cor
-0.4576683
Posted: July 4th, 2010 | Author: yamakk | Filed under: 技術 | Tags: mac , math , python , rpy2 , statistics | No Comments »